
STATISTICS. — This term derives, in all probability, from the Latin status, meaning state, position, condition, or manner of being. It was first used in Italy, in 1589, by Ghilini, and subsequently by Achenvall and others to designate the science that describes and examines the most notable aspects of the State.
Today the term s. is commonly used to indicate a collection of numbers concerning phenomena capable of enumeration and measurement, such as, for example, statistics of the clergy, production statistics, statistics of pupils, etc.,
but in the scientific sense s. is regarded as “a technique suited to the quantitative study of mass or collective phenomena, by mass or collective phenomena meaning those phenomena (physical, biological, social) whose measurement requires a mass or collection of observations of other, simpler phenomena known as single or individual phenomena” (Gini).
In this sense, s. serves to study reality—that of the natural world and that of the social world—in its phenomenal aspects, understood not as individual cases or facts, but as a set of cases or facts capable of observation. It helps to discover relationships, regularities, and laws that are difficult to deduce on the basis of single or few observations.
To s. in the scientific sense mentioned above, the attribute “methodological” is customarily applied, in order to distinguish it from applied s., which studies concrete collective phenomena by means of the procedures indicated by methodological s. This distinction has merely the value of a practical division (as, for example, between theoretical physics and experimental physics), intended to permit, on the one hand, the autonomous development of theoretical schemes and, on the other, an in-depth study of specific phenomena.
I. HISTORICAL NOTES
Ancient documents show that, from the formation of the first human societies onward, the system was used of enumerating both the elements of which such societies were composed (families, individuals, men fit for military service, etc.) and the goods at their disposal (livestock, products of the hunt, etc.).The Church itself felt the need for records, for its spiritual purposes, and instituted, one might almost say from the beginning, the registration of births and deaths. Indeed, the Council of Trent (sess. XXIV, de reform., c. 1) expressly required parish priests to keep the registers relating to births, deaths, and marriages up to date; and it is precisely to these sources that recourse is generally had today in order to study the demographic conditions of past centuries (v. LIBRI PARROCCHIALI).
Enumerations evidently lay at the basis of inquiries of an administrative and political nature. But around the middle of the seventeenth century, the description of the notable features of the State assumed an organic arrangement in studies possessing an autonomous interest. Scientific statistics then originated. Vito di Seckendorff (1626–92), Ermanno Conring (1600–81), and Goffredo Achenwall (1719–72) may be regarded as representatives of the so-called German university Statistics. At the same time, in England, there developed the approach known as that of the Political Arithmeticians, who sought, from numerical data, to derive the empirical laws governing social phenomena. This approach consequently had an investigative character, in contrast to the German one, which was descriptive. The best-known representatives of this school are John Graunt (1620–74) and William Petty (1623–87) for phenomena concerning the population; Gregory King (1648–1712) and Charles Davenant (1656–1714) for economic phenomena; and the astronomer Edmond Halley (1656–1742) for the branch now called insurance statistics, having constructed a mortality table for the inhabitants of Breslau. In the following years, population statistics underwent particularly important development, and it may be said to have reached maturity with the work of Gian Pietro Slassmilch (1707–67): L'ordine divino nelle mutazioni del genere umano. This author attributes to divine order the fact that births exceed deaths and that the sex ratio is nearly constant (according to subsequent studies, around 105 or 106 males for every 100 females at all times and in all places). Already three or four centuries earlier, however, as Villani reports in his chronicles, this phenomenon of the higher male birth rate had been observed and recorded in the baptistery of S. Giovanni in Florence by systematically examining the baptismal records.
(from Compendio Statistico Ital., Rome 1958, fig. 1)
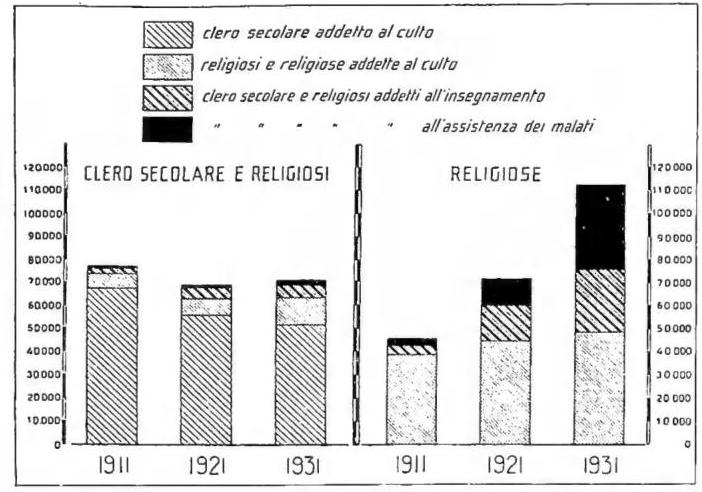
STATISTICA — Fig. 1. Secular clergy, religious men, and religious women in Italy by category.
By developing the calculus of probabilities, they provided statistical science with a powerful means of investigation. A very important impetus was subsequently given by the Belgian Adolphe Quetelet (1796–1874). He laid the foundations of modern statistical methodology and, employing it, considerably deepened studies of the population, crime, suicides, the physical development of human beings, etc. After him, many continued to perfect and expand statistical methodology; among the best known in Italy are Pareto, Benini, and Gini.
II. THE COLLECTION OF DATA
The point of departure for statistical observation is the collection of data. This consists in that set of operations through which knowledge is gained of a collective phenomenon. The accuracy of the deductions to be drawn will depend on the technique employed and on the care taken in carrying out the operations necessary for this purpose; for this reason, the collection of data constitutes the most delicate stage of statistical observation.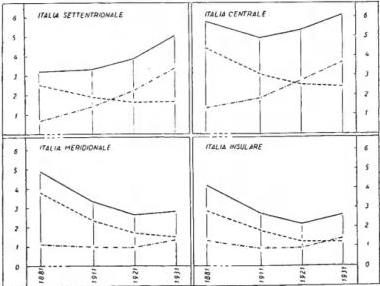
Four stages may be distinguished in the collection of data:
1. Determination of the collection plan
In determining the collection plan, the object and the statistical unit of collection must be precisely defined. This may be simple (an individual, a commodity of a given quality, a particular category of livestock, etc.), or composite (a family, as an aggregate of persons linked by particular ties; an almond grove, as an aggregate of plants of the same type, etc.), or complex, as in the case of economic censuses, where one is dealing with enterprises comprising units of various kinds. In relation to the time and resources available for the collection, it may be complete or partial, depending on whether or not it includes all the units in the field to which the investigation is intended to refer.The set of statistical units considered in a partial collection is said to constitute a sample. The criterion used to select the units making up the sample is of great importance for the accuracy or representativeness of the statistical information derived from II. Indeed, it is clear that the implicit purpose of studying the sample is to obtain the most accurate possible information (within a given margin of uncertainty) about the mass of cases, or universe in Anglo-Saxon terminology, from which the sample is drawn.
2. Obtaining or collecting the data
The collection plan also establishes the procedures for obtaining the data. Questionnaires are usually used (e.g., family forms in censuses), or forms or cards in which the information to be requested is specified in the form of questions. This system facilitates the collection and transmission of the data, as well as the appropriate grouping of the units surveyed according to homogeneous characteristics. Civil-status records (births, marriages, deaths, migrations) are brought to the attention of the collector by means of declarations made compulsory by legal provisions. These collections are called automatic and are generally transcribed into registers, whereas the others are called reflective, as in the case of censuses (v. POPOLAZIONE).3. Processing of the data
As regards the processing of the information recorded on questionnaires, forms, registers, etc., one first proceeds to appropriate classifications, so that homogeneous groups are formed for each characteristic (e.g., sex, age, occupation); then, if the cases are not numerous, one proceeds either, as in the past, by manually enumerating the units in each group, or, when the number of statistical units is large, by processing them with mechanical means. Without going into how these operate, it is enough to say that they consist of a perforator, which makes it possible to transcribe the data from the form conventionally by means of holes distributed along columns on a special card or standard form, and then of a sorter or classifier, which moves the perforated cards across two planes, causing those with one or more holes in specified positions (corresponding to a recorded characteristic) to fall into appropriate compartments. The results of the processing are entered in special tables, called statistical tables, of which numerous examples may be found, for instance, by consulting the statistical yearbooks published by the individual States.III. GRAPHICAL REPRESENTATIONS
Statistical data deriving from a survey may be rep-(from Compendio Statistico Ital., Rome 1958, fig. 2)
STATISTICA - Fig. 2. --- Secular clergy and religious; --- religious; --- total, in the four Italian geographical divisions, from 1881 to 1931; Figures per 1,000 inhabitants.
Two fundamental types of graphical representations may be distinguished: a) diagrams; b) cartograms.
The principle governing the construction of diagrams is to make a geometric figure correspond to a number (e.g., a segment, a rectangle, an angle, a circle, etc.).
Fig. 1 is a diagram of superimposed rectangles indicating the size of the secular clergy, religious men, and religious women in Italy in the census years 1911, 1921, and 1931; by observing this graph, one immediately sees which category is the most numerous and which underwent the greatest changes during the two decades considered.
A diagram with orthogonal Cartesian coordinates is shown in fig. 2; at a glance, it displays the differing changes in the numerical strength of the secular clergy, religious men, and religious women in the four Italian geographical divisions from 1881 to 1931.
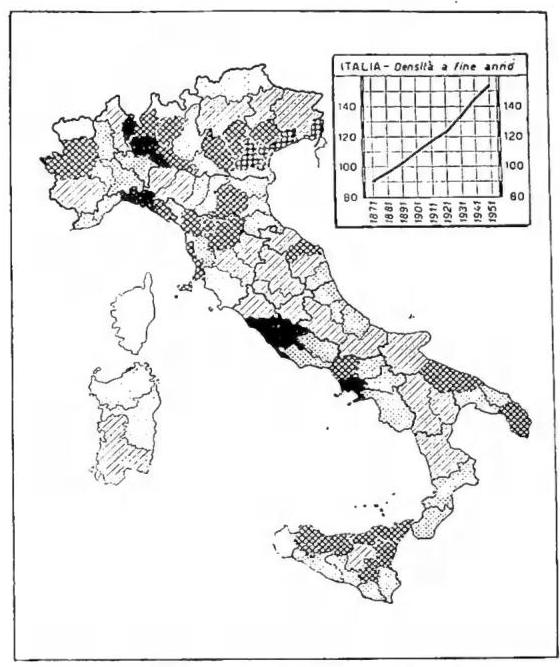
Cartograms, on the other hand, are based on the geographical outlines of an area (continent, nation, region, etc.), with the relevant subdivisions; in each of these subdivisions, the intensity of the phenomenon represented is indicated by the more or less pronounced shading (or hatching) applied there.
The cartogram in fig. 3 indicates the number of inhabitants per square kilometre of surface area in the Italian provinces.
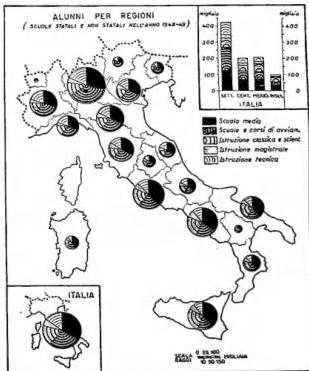
If one wishes to indicate the size of several categories in each geographical area, one may use the system of inserting in each area a figure (formed by rectangles or circular sectors, or by other designs), so that its size provides an indication of the extent of the various categories of the phenomenon.
Fig. 4 represents, for example, the number of pupils enrolled in each type of Italian secondary school in the various regions.
IV. MEASUREMENT OF THE INTENSITY OF A COLLECTIVE PHENOMENON
The data obtained through statistical observation are not always suited to provide a synthetic idea of the phenomenon or to permit a comparison of that phenomenon with others. For example, the different prices obtained in the numerous Italian markets of a region for the same quantity of a commodity are not, as they stand, suitable for making a concise comparison with the prices of other commodities or for studying the variations in the price of that quality of commodity over time. It is therefore necessary to know how to synthesize all these raw figures into a single value that measures the intensity of the phenomenon: this is called the mean value. Our mind too, in certain circumstances, summarizes various impressions into a more synthetic one; the mathematical method has the advantage of making this determination more objective. However, one may proceed in different ways, each of which corresponds to particular requirements, obtaining different mean values, with correspondingly different names, the principal ones being: simple arithmetic mean, weighted arithmetic mean, simple and weighted geometric mean, harmonic mean, median, normal value or mode or predominant value, means of powers, etc.Once the mean intensity of a collective phenomenon has been determined, it may be of practical and scientific interest to measure variability, that is, the tendency of phenomena to assume different modalities. It is clear, in fact, that it is often not enough to know the average wealth of the inhabitants of two regions; it may also be of interest to know the inequality existing among these inhabitants. In two countries A and B, average wealth may be identical, but its distribution among the inhabitants may be very different in A and B. The same may be said of wages, heights, etc., which in A may be almost equal among all persons, whereas in B they may differ greatly from one individual to another.
S. has developed appropriate measures called indices of variability. The principal ones are: range of variation, mean absolute deviation, root-mean-square deviation, mean difference, concentration ratio. The latter measure is of great importance in the field of eco-
V. RAPPORTI E RELAZIONI STATISTICHE
When a logical connection exists between two collective phenomena or between a collective phenomenon and a non-collective one (as, for example, between wealth and population, between legitimate births and married women, between population and territory, between deaths from a given cause and deaths in general, etc.), a statistical ratio may be established between the intensities of the two phenomena, generally expressed as a percentage.The principal ones are: the ratio of composition, or part to whole; the ratio of derivation; the index ratio, or index number; the ratio of coexistence; the ratio of duration; and the ratio of repetition. Sometimes, however, it is of interest to see whether the modalities of one phenomenon are sensitive to the quantitative or qualitative manifestations of another phenomenon. For example, it is of interest to see whether the modalities of stature depend on the modalities of occupation, whether the modalities of income are related to those of wealth, etc. The study of this aspect is known as the investigation of the relationship between two phenomena (more precisely, between the modalities of two phenomena). It can be undertaken from different points of view. For example, by comparing two distributions globally, one can observe concomitance, transvariation, dissimilarity, asymmetry, abnormality, etc. By comparing the individual modalities, on the other hand, one can measure the degree of connection or dependence, and the degree of concordance or correlation, for which s. has developed various appropriate indices.
Other important chapters of s. concern: the integration of data (by developing methods for eliminating or correcting gaps, errors, causes of the non-representativeness of data, etc.); the comparability of data (in order to eliminate the intrinsic and extrinsic causes that sometimes render direct comparisons between statistical data erroneous); and finally, the logic of s., which, through an in-depth examination of the various stages of scientific research and of the symptomatology of causes, arrives at the formulation of laws and at the prediction of collective phenomena in the future, this being the ultimate purpose of s.
VI. APPLIED STATISTICS
The application of the statistical method to the study of particular classes of phenomena gives rise to separate disciplines such as demographic statistics or demography, biometry, anthropometry, physical statistics, economic statistics or economics, and social statistics, which in turn comprises judicial statistics, moral statistics, health statistics, labour statistics, intellectual statistics, religious statistics, etc.A brief account is given here of some of these branches, with reference to the respective demography (v.), biometry (v.), and anthropometry.
4. PHYSICAL STATISTICS
Statistics have made a decisive contribution to modern physics, where they have made possible enormous advances that were previously unimaginable before their introduction into this science. The branches that have benefited most are the kinetic theory of gases, thermodynamics (v.), quantum theory (v.), and theories concerning the nature of the structure of the atom.5. ECONOMIC STATISTICS OR ECONOMICS
This studies, by statistical methods, the phenomena of production, exchange, and consumption. It therefore undertakes the collection and analysis of data concerning industrial, mining, and agricultural production; wholesale and retail trade, both domestic and international; the prices of goods and services; family budgets; the cost of living; wages; the financial and banking market; railway, road, maritime, and air traffic; income; wealth; etc., so as to obtain accurate knowledge of the phenomena arising from the activities that people undertake to satisfy their needs. These phenomena are often related to demographic and social phenomena in order to illustrate the economic life and development of a country.6. SOCIAL STATISTICS
This studies various classes of phenomena connected with the social life of human groups. Some of these classes of phenomena tend to constitute subjects of separate disciplines, and brief accounts of them are given: a) Judicial statistics. — Their subject is the quantitative study both of the activity of state organs aimed at restoring a right violated by an unlawful act or disturbed by a dispute, and of the persons, matters, and acts to which that activity relates (Spallanzani). They distinguish: a) criminal judicial statistics (offences against the person, against property, against public morals, crime, reformatories, etc.); b) civil judicial statistics (litigation, personal separations of spouses, notarial acts, etc.); c) commercial judicial statistics (bankruptcies, bills-of-exchange protests, etc.). b) Moral statistics. — These study quantitatively those phenomena relating to custom and morality in general, such as alcoholism, prostitution, begging, etc.). c) Health statistics. — These comprise the body of research connected with morbid conditions of a social character (tuberculosis and other infectious diseases, the mentally ill, etc.), health and hospital assistance, centres for the diagnosis and treatment of malignant tumours, health services, etc. d) Labour statistics. — These study phenomena concerning the employment and unemployment of workers, remuneration for labour, strikes and lockouts, internal migrations for work, trade-union associations, etc. e) Intellectual statistics. — These concern: a) phenomena in the school sphere, such as enrolments, examinees, those passing, those graduating, university graduates, and teachers of every kind and level of school; b) the activity of academies, libraries, picture galleries, archives, etc.; c) performances and radio; d) the press, copyright, etc.7. RELIGIOUS STATISTICS
This concerns the quantitative study of phenomena directly or indirectly connected with religion. It therefore comprises, on the one hand, phenomena arising from the spiritual and social activity of the individual Churches and, on the other, all those social phenomena that are not properly religious but are subject, to varying degrees, to the influence of religion. The very different characteristics of these two groups of phenomena lead to a division of religious statistics into two parts: ecclesiastical statistics and confessional statistics.8. ECCLESIASTICAL STATISTICS
Among the branches of social statistics, this may be said to have been, until not long ago, the most neglected, above all for lack of documentary material. Certain proposals made by the Central Statistical Commission in 1872 and 1879 to carry out an extensive inquiry: a) into the persons engaged in worship and the population; b) into things devoted to worship, such as buildings, sacred furnishings, the property of ecclesiastical institutions, tithes, collections, offerings, etc.); c) into acts relating to worship, were not implemented, because it is evident that, in order to record phenomena relating to the life of the Church, its exercise, and religious practices, an organ directly dependent upon the Holy See is required.An important flowering of studies in ecclesiastical statistics took place in Italy around 1940. The most important subjects on which studies are available concern the numerical strength of the secular clergy, religious men, and religious women in Italy from 1881 to 1936; the average age of missionaries and of the clergy resident in their homeland; the longevity of the Princes of the Church; parish agricultural land; the age of children at Baptism; the frequency of the Sacraments; etc.
The Annuario Pontificio, having begun from 1944 onward to publish a number of statistical data, opens the way to a more organic and systematic statistical knowledge of the phenomena that more properly concern the field of ecclesiastical statistics.
9. CONFESSIONAL STATISTICS
This studies in particular the demographic and socio-economic aspects of confessional groups and could also be called, more properly, statistics of confessional groups. Its importance is greatest in countries with a strong religious mixture, whereas it is least in countries that, from a religious point of view, display a high degree of homogeneity. From the demographic aspect, the study of their numerical strength is of interest. For example, around 1936, of the 2,084,000,000 inhabitants of the earth, 35.3% were Christian, 59.8% non-Christian, and the remainder of unknown religion or without religion. Comparisons concerning the dynamic characteristics of confessional groups are also very important, such as natural movement (births, deaths, marriages), religious movement represented by conversions, and migratory movement, which in some countries has altered the composition of existing confessional groups. From the socio-economic aspect, the study of their occupational composition, their degree of education, well-being, and wealth, their hygienic and health conditions, their morality, the frequency of suicides, etc., is likewise important.These studies make it clear that religion considerably influences the moral and social conduct of individuals.
BIBLI: C. D'Agata, S. religiosa, in Trattato elementare di s. diretto da C. Gini, Milano 1943 (con ampia bibl.); P. Droulers, La sociologia religiosa presso i cattolici dei diversi paesi, in Scuola catt., 79 (1951) pp. 234-44; autori vari, Milieux modernes et Vie religieuse. Etat présent de la Sociol. religieuse, in Lumen vitae, 6 (1951), pp. 1-407; P. Droulers - A. Rimoldi, La sociol. religiosa Italia, in Scuola catt., 80 (1952), pp. 80-107, 169-93. Tommaso Salvemini